
5 Perfect Web Application Monitoring Tools that Enhance User Experience
Monitoring and improving the user experience requires a lot of data. This information later has to be collected, stored, and analyzed.
70% of a launched product, service, event, or platform’s success depends on how efficiently the developers perform those steps.
But, can you execute all of them without any help from a tool? One word is impossible. The possible scenario will be, you have been driven crazy trying to handle the monitoring, and even a successful launch of your product feels bitter.
So, you need a monitoring tool that can quickly check your audience’s experiences and engagements. The tool can organize the data from your app by making pie charts, columns, metrics, graphs, and blocks. This makes it easy to see how your products are doing right now.
We will go over some fantastic web application monitoring tools that can completely assist you.
Let’s get started.
What is Web Application Monitoring?

In simple terms, web app monitoring is a continuous process that is capable of identifying, diagnosing, and resolving the app performance and running problems. It can recognize errors and bugs before the program is available to the users or market.
Like a Javascript agent, server monitoring tools can be inserted into the client’s web browser or through network tracks packages over the wire. These two forms are example of real-user monitoring.
5 Types of Web Application Monitoring Explained
There are a few fundamental points to execute the monitoring process. Based on these points, mainly 5 types of application monitoring are possible.
1. App accessibility monitoring
Any web app will have to be available or accessible to the general after launch. If it’s unavailable to the users without any developer notice, then the application has issues.
Regular app availability monitoring checks the continuous runtime, data response, service request-response, and online-offline status of the app.
2. Application process monitoring
Continuous runtime is crucial, but smooth performance is the key to a seamless end-user experience.
Sometimes, a launched application comes with numerous bugs or a massive server load that can affect the application’s performance. Hence maintaining the application performance through precise monitoring is a must.
3. Errors and bug monitoring
Probably one of the most annoying problems is encountering a bug application. The monitoring process is based on 2 types of errors, human-made errors, and machine errors.
The monitoring responses for bugs and errors will be a notice from the developers, closing the program for a period, and creating a patch. Bug monitoring is tricky and sometimes requires a lot of time to fix.
But, a good thing is previous fix experience can help the devs for later patches.
4. Stored data monitoring
Every notable happening in a web application runtime is recorded as data known as log files. These files can give a clear-cut preview of any problem that occurred within the application.
Instead of being stored inside of the application itself, this data is stored in a massive database. So, these databases are crucial for the consistent monitoring of software.
Monitoring the database will let you know if there is a problem with the data storage and what can affect the active functionality of the overlying application.
5. Security monitoring
Probably security of an application is one of the most prioritized topics for both devs and users. The web is not a secure place. According to a post from Ciab, the NSA data center experiences nearly 300 million hacking attempts in a single day.
Cyber security is a concerning matter for both web applications and sites. The intent for a hacking attempt, data breach, malicious component injection, or other types of threats is always possible. Security monitoring can help you stay 24/7 protected from these menaces.
However, security monitoring depends on both the user and developer sites. The most common threats can be detected by standard antivirus software. However, some high-end antivirus software can detect every threat and unusual system activity. If you are a WordPress user then there are certain ways to save your WordPress site or product.
Your selected APM tool should ensure all the above monitoring types to ensure the best end-user experience possible.
What Standard Features an APM Tool Should Have

Launching a web application is a baby step in the entire process of development. Because there is a lot of things to consider. Such as-
- How well is the app performing on the web?
- Are there any bugs, errors, or problems in the code?
- Is the beta version popular among specific users?
- Does this app need more improvements?
- Will this app reach the preferred expectations?
It’s nearly impossible for a developer team to predict all of these. But, the good part is they don’t have to guess anything accurately. An app’s success primarily depends on regular and persistent monitoring.
Your APM tool should ensure these points.
1. Accurate detection of bugs or error
Users want to get the best experience possible, even in the beta version of an app. But, developers can’t ensure a 100% error-free experience after launch. Sometimes, a slight mistake in the code can ruin the entire marketing opportunity for the application.
By prioritizing the front-end user experience, an APM tool should detect every bug and error in the program. These bug reports and notes will later help the devs take the necessary precautions to create a patch.
Moreover, the reported description should have to be perfectly accurate. The information should also be presented and organized.
2. Should support the popular framework
Developers want their applications to be more interactive and simple for the targeted audience. The users want to have a definite and perfect outcome from their application.
Users feel more comfortable when their used monitoring applications are connectable to popular frameworks like React, Angular, or Vue.js. These apps get more attention.
Any programmer will definitely want to speed up the working process by detecting bugs and errors faster. The thing is, it’s nearly impossible for a human to identify every error in a code sheet correctly, and the same goes for the fixes.
If the monitoring app supports the used framework, then developers can fix the problem immediately. For being a good developer you must know these things.
3. Efficiency with huge data
Unlike PC applications, web applications continually run for months straight and may have massive traffic. These specific web applications require an effective and efficient monitoring system.
Take Gmail for an example. Nearly 316 billion emails are sent each day and produce an extensive amount of data.
But, the platform still works perfectly. Maintaining this consistent faultless operation is possible for Google’s cloud monitoring system. An APM tool should ensure persistent performance 24/7.
5 Best Web Application Monitoring Tools
| Tools | Reviews G2 | Free Trial | Pricing |
| Solarwinds TraceView | 250 | Free Trial Available | Starts From $39.50 |
| Dynatrace | 1033 | 14 Days Free Trial | Starts From $11 |
| Freshping | 688 | Basic Free Plan | Starts From $11 |
| DELL Foglight | 46 | Free Trial Available | Starts From $499/Year |
| LogicMonitor | 373 | No Free Trial Available | Unknown |
These tools for monitoring web applications are some of the best that professionals and users think about. Our expert team also tested a few of them to check the overall performance, and they were pretty satisfied.
Well, no application is 100% perfect, but you can always rely on experts’ opinions.
1. Solarwinds traceView
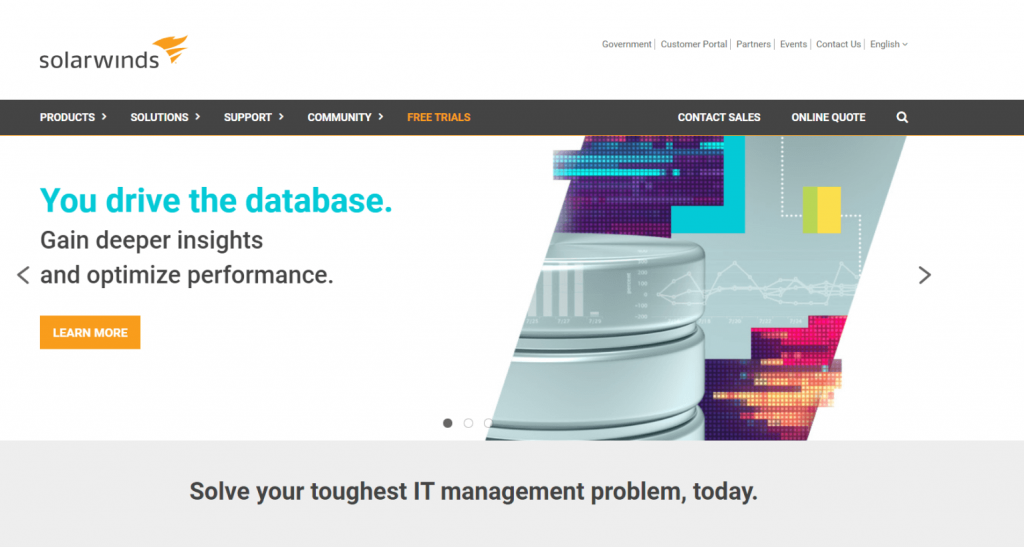
Solarwind is a famous Chinese IT company that thrives on developing sophisticated applications. Their main line of products consists of network, system, security, and service management apps. The company is widespread in China and all over East Asia.
Traceview is one of a kind app monitoring tool that can literally work in any way the user wants. You can track every machine involved in transactions and identify complex “bottlenecks.”
Moreover, the system can track down the components that are slowing or hindering your program’s run.
The UI interface is pretty simple to understand, and most of the presented information is organized. Another interesting thing about Traceview is the installation time. It takes half a minute to install this tool, and extra coding is not required in later stages.
You are also getting Solarwind cloud computing service, which can help to monitor cloud-native applications and infrastructures.
Notable Highlights
- Unique monthly pricing system.
- Cross-host distributed transaction support.
- 8 general language coverage.
- Performance-based zoom.
- Excellent visualization of the interface.
- Supports end-user monitoring.
- Automated topology mapping
- Traceable data is viewable for 90 days.
2. Dynatrace
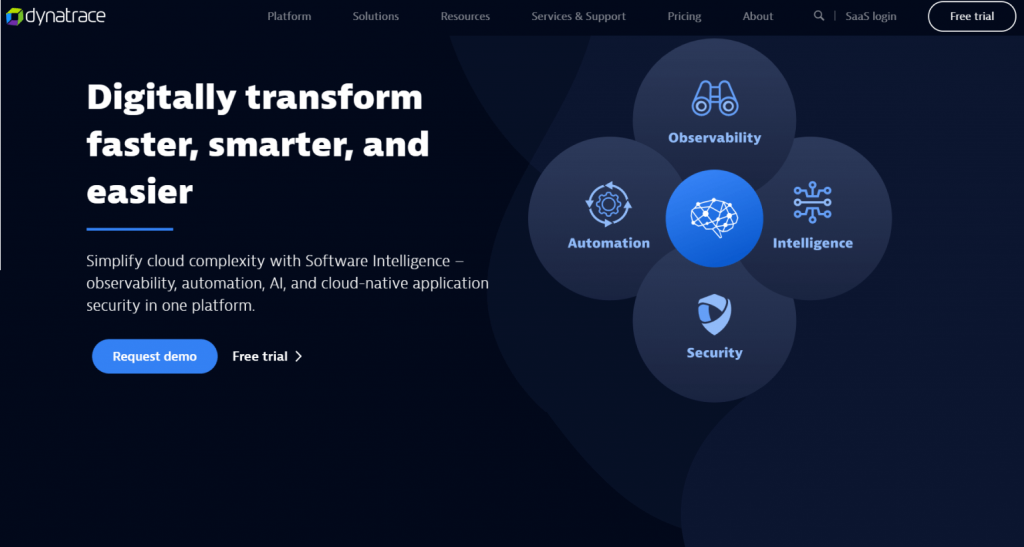
The company was founded in 2005 in Waltham. For its rising popularity, at present, there are 2000 employees employed and ever-increasing. In the 2017 financial year, the brand generated a straight $354 million of revenue.
What happens when you put everything on a platform that works simultaneously without any delay or interruption? Dynatrace is one of those monitoring applications.
Comparing Dynatrace as a single monitoring app is totally wrong. It’s more like a multifunctional capable platform system. It is famous for monitoring, cloud storage, marketing analysis, notified problem solutions, customer behavior analysis, connectivity, app security, and AI system.
Moreover, the achievements of Dynatrace are groundbreaking. More than 500 popular applications, like Amazon Aurora, Akka, Drupal, Adobe Analytics, Consul Service Mash, CoreDNS, and many more, use Dynatrace.
Dynatrace was placed in 31 out of the top 50 best-selling global products on the G2 platform.
Notable Highlights
- Mobile web browser supported.
- Real-user and synthetic monitoring.
- Hybrid cloud observability.
- Domain isolation.
- Runtime vulnerability detecting capability.
- Automatic code-level root-cause profiling.
- Automated AI systems can detect performance issues.
- Supports .NET and Java programming language.
3. Freshping
Freshworks is a multipurpose online software-based company that mainly develops applications for business management and customer service.
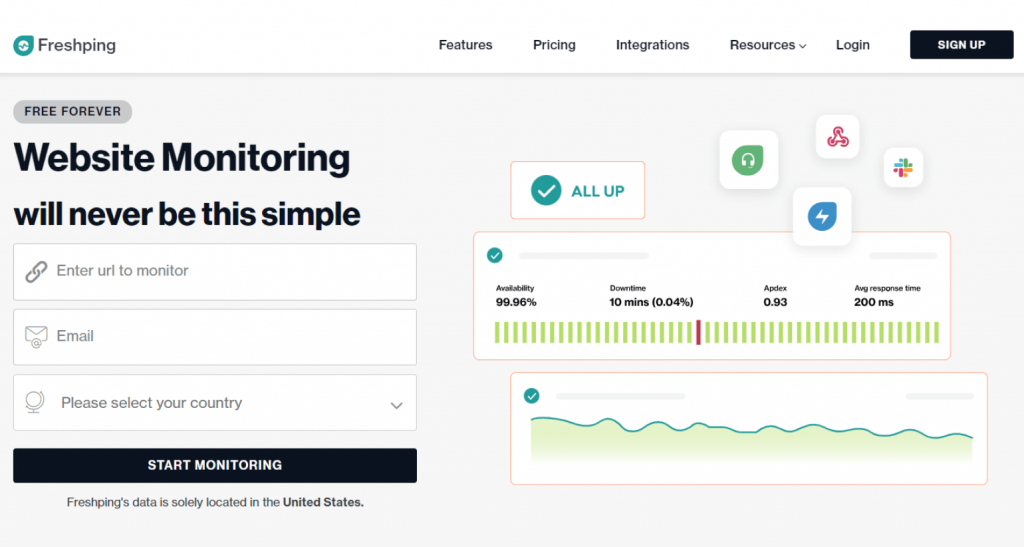
Freshping is one of them which is a website and application monitoring tool that can easily monitor up to 50 URLs. The best part about this monitoring application is it’s pretty easy to understand and free to use. Freshping offers reliable protocol monitoring for totally free, which makes it one of the best web application monitoring tools.
Moreover, you can check the website’s availability and response time in seconds. Efficiently increase your website’s traffic, improve its performance, and make it run faster with Freshping’s advanced monitoring process.
Other than HTTP protocols, this intelligent tool can monitor multi-port and protocols like ICMP ping, TCP, PNS, and UDP. From startups to online giants, Freshping can be of pretty good service.
Freshping was in the top 100 fastest-growing products in the G2 marketing and service application review platform.
Notable Highlights
- Supports SSL certificate monitoring.
- Domain resolution error detection.
- String and status code check.
- Downtime alert system.
- Performance alert.
- Freshdesk integration for downtimes.
- Connectable in more than 25 communication platforms.
- Real-time status showcase system.
4. DELL foglight
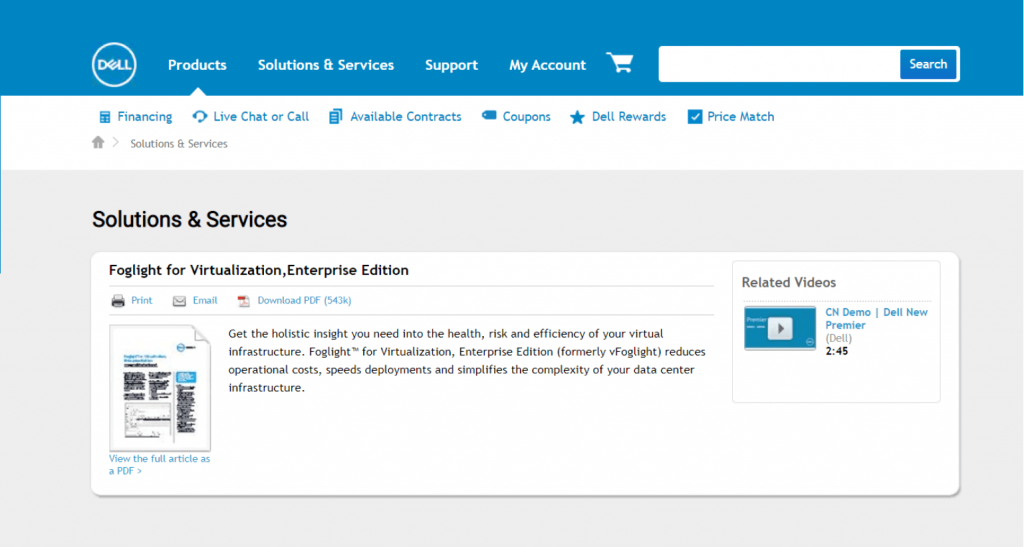
DELL is an IT software developing international company that was founded in 1984 in Texas, United States. Later, DELL acquired the “Quest” company, which was a leading monitoring software brand in 2011.
The difference between Foglight and various other monitoring applications is the working process. Traditional monitoring tools specifically identify errors and alerts the users. However, Foglight can detect and resolve issues at the same time.
It can also cross-map between application and database, which improves user experience. The advanced system can detect issues faster in virtual environments, databases, and devices.
Foglight is integrable with specific monitoring applications and can monitor infrastructure performance.
Notable Highlights
- Supports Java, .NET, and AJAX.
- Simplify complex IT environments.
- Workload migration.
- Simple UI interface.
- Shared tool system.
- Multi-cloud spends control.
- Customizable alerts.
- Cloud cost modeling structure.
5. LogicMonitor
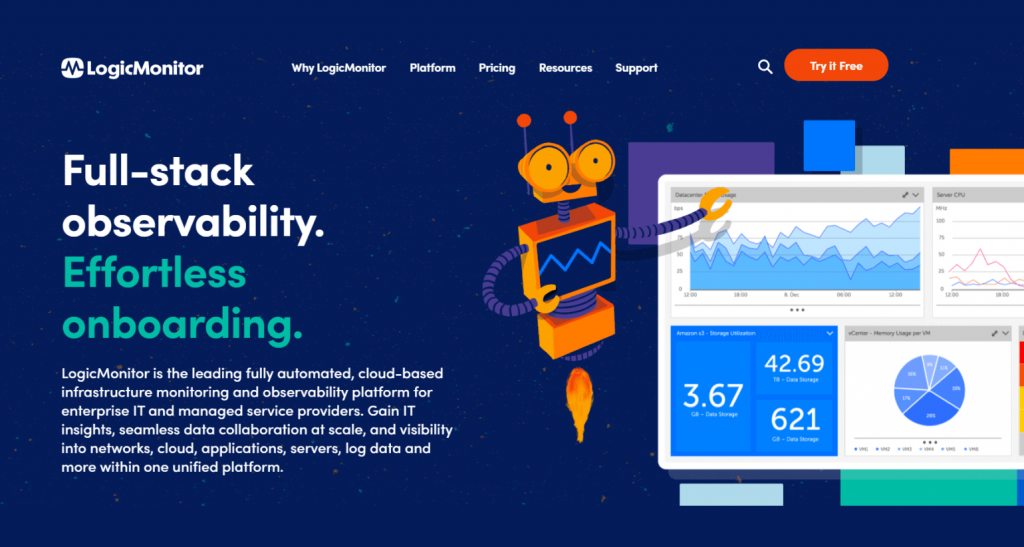
LogicMonitor is a multipurpose cloud-based monitoring tool for IT management, enterprise, and service providers. The official company was launched in 2007, Santa Barbara, California.
Just like Dynatrace, LogicMonitor is also capable of monitoring many things at once and is fully automated. You can gain crucial insights about your product and business at ease.
Moreover, data collaboration is pretty smooth and has clear network visibility through cloud storage, servers, applications, log data, etc. LogicMonitor also helps fasten the load of complex applications in the network.
With LogicMonitor, you don’t have to use third-party security applications. The tool uses an automatic data encryption process, which makes the transited data secure in input and output.
The authentication controls are also stabler for 2FA and SAML synthesis. Overall the process is quite reliable.
Notable Highlights
- Data collection through outbound communications.
- Log analysis.
- Website monitoring.
- Data track-flow through a network.
- Topology mapping.
- AIOPs early monitoring system.
- Data retention and 24/7 customer support.
Relevant FAQs on Web Application Monitoring Tools
Question 1: What is an APM tool?
Answer: APM stands for Application Performance Management or application performance monitoring tool. Practically, the work of an APM tool is to monitor, enhance, detect an error, and optimize a web application’s performance.
Question 2: What are some steps of monitoring?
Answer: The best possible monitoring includes 5 steps,
– Project plan outline.
– Capabilities and requirements review.
– Data gathering plan framework.
– Create a deployment plan.
– Approach and evaluate.
Question 3: What is the definition of the M&E framework?
Answer: The M&F is a structure or table-based information that is used to measure the success or overall progress of a web application program.
Question 4: Is splunk an APM tool?
Answer: No, Splunk is not an APM tool. It’s more likely a log management tool.
Question 5: Why is monitoring crucial for an application?
Answer: All the track implementations in a program, program’s efficiency, bug or error status, and seamlessness are possible through accurate monitoring. It helps the overall progress, which aids the developers when and where to propose a change.
The Bottom Line
The internet is an extensive place, which makes it hard to grow a business without potential rivals. But, it’s not impossible to reach success through an enormous amount of effort.
A monitoring tool can ease this journey through relevant information and a synchronized path. It’s best to not think about this and let the AI system analyze, collect, and configure your information.
Here is a crazy fact. You will be amazed to know that Facebook produces 4 petabytes of data, which is equivalent to 4000 terabytes of data. They spent 20 to 25 million dollars on their giant servers in a year.
So, what are your thoughts on web application monitoring tools? Let us know in the comments with your most valuable opinions and queries.
Have a great day, Sayonara!
Subscribe To Our Newsletter
Don’t miss any updates of our new templates and extensions
and all the astonishing offers we bring for you.

Interesting post.
Thanks Ricki.
Glad that you liked it.
– Tanvir.