Have you ever found yourself in a dilemma of choosing between a number of really good options, where each one pulling you in a different direction? What you do in such situations? Actually, there is a big difference between what you do and what you should do.
You can select any option blindly if you want. Or, make an informed decision based on a pristine set of data collected with carefulness. Wise people usually opt for the second option, which you should do as well. But how to make such a decision?
In this article, we’ll show you a step-by-step guide on data driven decision making. You’ll learn what data-driven decision making is, the benefits of data-driven decision making, and how to make it. Let’s get into it.
What is Data Driven Decision Making?
Data driven decision making refers to the process of deciding on choices based on actual data instead of hypothetical assumptions. It involves collecting and analyzing data for reasoning. By looking at data, you can understand market trends and predict outcomes. This leads you to make decisions based on facts and evidence.
Using data in decision-making helps in reducing mistakes and improving efficiency. It allows you to explore what is really working and what is not. By focusing on these insights, you can make better strategies, solve problems more effectively, and stay ahead of competitors.
Benefits of Data Driven Decision Making

There are many areas where data-driven decision-making is very important. In your personal life, you may make some odd decisions. But if you’re a business owner or in a top position in a large company, you can’t avoid the importance of data-driven decision-making. Let’s take a look at some of its key benefits:
- Increased Objectivity
When decisions are based on data, there is less chance for personal biases or opinions. It means the choices are grounded based on facts and evidence, making them more fair and balanced.
- Predictive Capabilities
Data analysis can help predict future trends. You, as a decision-maker, can prepare for what’s coming next, rather than just reacting to what has already happened.
- Better Resource Allocation
Data shows where resources are most needed and most effective. This will create a sense in your mind of how to spend your time, money, and effort in the right places, improving efficiency and outcomes.
- Enhanced Customer Insights
By analyzing customer data, you can better understand what your customers want and need. This can help create products and services that truly satisfy customers.
- Competitive Advantage
Using data smartly gives businesses a leg up over competitors. They can spot trends, react quickly to changes, and make better decisions, staying ahead in the market.
- Informed Risk Management
Data helps identify potential risks early on. You can then take steps to avoid and mitigate business risks, leading to safer and more secure operations.
How to Make Data Driven Decisions
Data-driven decision-making involves completing a series of steps. All the distinguished business personnel and top authorities have been seen to be following these steps. Let’s explore the steps of how to make data-driven decisions below.
Step 01. Define the Objective

Defining the objective is like setting the destination of a journey. Once you have a clear sense of where you are headed, the picture becomes clear what you want to achieve. Suppose you want to improve customer service. But how to change your goal?
Instead of setting a trendy goal, you can set the objective of reducing the average response time by 30% within the next month. This not only sets an objective but also provides a clear sense of direction for achieving it.
Besides, it provides clarity and focus, guiding decision-making processes and resource allocation. Make sure the objective is clear, actionable, and achievable.
Step 02. Identify Key Metrics and Data Requirements
Identifying key metrics and data requirements is similar to gathering the tools required for completing a task. In this step, you have to pinpoint the vital pieces of information that will guide decision-making and evaluate the progress toward the defined objective.
Identifying key project management metrics can guide you in what type of data and information you need. Based on your goal, you can gather customer information whether from search platforms or social media. This guide can save you considerable time.
For Example:
Let’s say you manage an online store, and your objective is to increase the average order value (AOV) by 15% in the next quarter. Here’s how you could identify key metrics and data requirements:
- Average Order Value (AOV): The average amount spent per order.
- Conversion Rate: The percentage of visitors who make a purchase.
- Customer Lifetime Value (CLV): The total revenue a business can expect from a single customer over time.
Step 03: Collect Relevant Data

Collecting relevant data is a must. But how to find it! You can explore internal sources like company databases, CRM systems, and financial records, as well as external sources like market research reports, customer feedback surveys, and industry benchmarks.
Plus, you can explore the platforms where your potential customers travel. There are many well-functional software and tools you can use to extract information from those platforms.
For example, you can use Google Analytics, Google Ads, and Search Console to gain insights about your web traffic, campaign performances, ad outcomes, keyword performances, etc.
Social media platforms like Facebook, Twitter, Instagram, and LinkedIn also provide analytics to collect relevant data about users from those platforms. Learn to use them suitably.
Step 04: Analyze and Interpret the Data
Once you have collected the relevant necessary data, it’s time to dig into it and explore what it tells you. You must examine their patterns, trends, and insights that can help you comprehend the situation better. This step is all about turning the raw data into meaningful information so decision making becomes easy.
Here’s a guide on how to analyze business data. You can do the following things here.
- Organize the data: Start by sorting and structuring the data in a way that makes it easy to work with. You may put the data into a spreadsheet or a database.
- Remove errors: Ensure the data is accurate and complete. Remove any errors, duplicates, or irrelevant information. For example, if you’re analyzing sales data, make sure all entries are correct and there are no typos.
- Use Statistical Tools: Using statistical features like formulas and equations, you can calculate the average, percentage, and other summary statistics. For example, you can calculate how your product is selling by day, week, month, and year.
- Visualize the Data: Create charts, graphs, or other visual aids to help you see the data more clearly. A bar graph showing monthly sales can quickly reveal which months are the strongest and which are weaker.
For example:
Imagine you run an online clothing store, and you’ve collected data on your monthly sales for the past year. When you analyze this data, you might find that:
– Sales are highest in November and December, likely due to holiday shopping.
– There’s a significant drop in sales during the summer months.
– Your best-selling items are winter coats and holiday-themed clothing.
By analyzing this data, you can make informed decisions about when to run sales promotions or which products to stock up on during different times of the year.
Step 05: Generate Insights
Generating insights is about interpreting the results of your data analysis to uncover meaningful patterns and understand the reasons behind them. It involves connecting these findings to your business context and goals and thinking about how you can act on them to improve your outcomes.
Although this step is somewhat similar to the above one, an important part ends here which is the generation of insights from the available data. So, how to generate insights over the collected data! Follow the steps below.
- Identify key findings: Look at the patterns, trends, and abnormalities in your data. For example, if you notice that customer satisfaction scores are consistently lower during certain months, this is a key finding.
- Understand the context: Look at external factors that might influence your data. If your sales spike in December, the context could be holiday shopping trends.
- Ask ‘Why’: Find out the reasons behind the patterns you’ve identified. If sales are dropping during the summer, ask why. It could be due to seasonality, or perhaps customers are on vacation.
- Connect the dots: Relate your findings to your business goals and objectives. How do these insights impact your overall strategy?
- Think actionable: It’s not enough to know that sales are higher in December. You need to think about how you can leverage this information. You can decide to increase your marketing efforts in November to maximize December sales.
Step 06: Develop Potential Solutions or Strategies

Developing potential solutions or strategies involves brainstorming ideas. Gather your team to brainstorm possible solutions. Encourage creativity and consider a wide range of ideas without immediate judgment. For example, if your goal is to increase online sales, brainstorm various marketing tactics, website improvements, and customer engagement strategies.
Assess the feasibility of each idea in terms of resources, time, and potential impact. Consider factors such as budget, manpower, technology, and market conditions. List their advantages and disadvantages. This helps in understanding the potential benefits and risks associated with each option.
Rank the potential solutions based on their feasibility, impact, and alignment with your objectives. Focus on solutions that offer the best balance of benefits and practicality. For example, if improving website speed is both feasible and likely to significantly boost sales, it might be a top priority.
Finally, think about both immediate actions and longer-term strategies. Some solutions may provide quick wins, while others may take longer to show results but offer more substantial benefits over time. Learn how to develop eCommerce marketing strategies.
Step 07: Make a Decision and Implement It
Making a decision requires careful consideration of all the information and insights gathered during the previous steps. This includes weighing the pros and cons of each potential solution, assessing their feasibility, and determining which option best aligns with your objectives and available resources.
Things you must consider in this stage are:
- Involve stakeholders: It’s important to involve key stakeholders in this process to ensure that the decision is well-rounded and considers different perspectives. Once a decision is made, you should be committed fully to it and ensure everyone involved is on the same page.
- Ensure effective communication: Implementation begins with clear communication of the decision and the detailed plan for executing it. All team members and stakeholders should understand their roles, responsibilities, and the timeline for implementation.
- Resource allocation: Ensure that all necessary resources, such as budget, personnel, and technology, are available and properly allocated. Set up a system for tracking the implementation process to ensure that the plan is being followed and any issues are addressed promptly.
Step 08: Adjust Based on Feedback and New Data
After implementing your decision, the journey doesn’t end there. It’s essential to continuously monitor progress, gather feedback, and analyze new data to ensure that your strategies are effective and aligned with your objectives. This step involves being flexible and willing to make adjustments to your plan based on the insights gained from ongoing feedback and new information.
Once the implementation is underway, regularly collect feedback from stakeholders, team members, and customers. This feedback can provide you with valuable insights into how well the implemented strategies are working and where improvements can be made.
New data may also emerge during the implementation phase that can influence decision-making. This could include changes in market conditions, competitor actions, or shifts in customer preferences. It’s essential to stay informed and adapt your strategies accordingly.
Make Data Driven Decisions on Themes and Plugins with Appsero
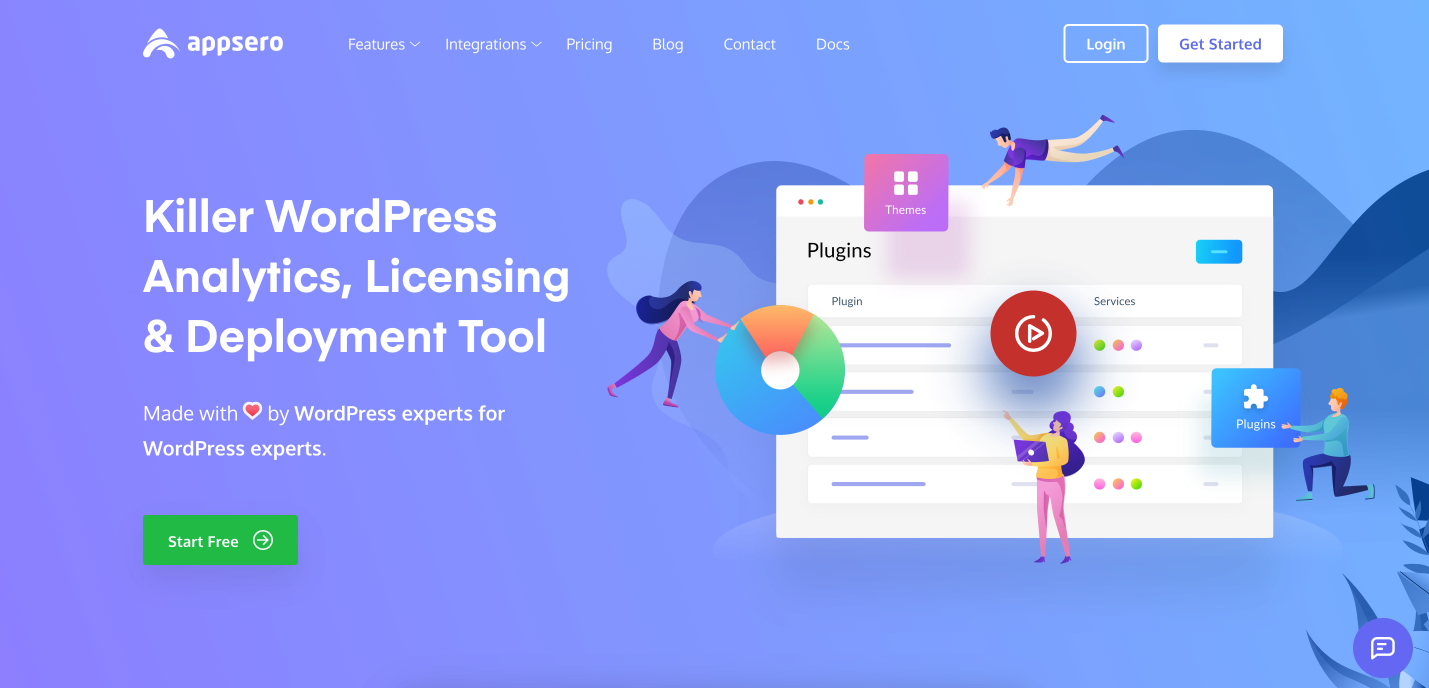
Appsero is a great license management tool for WordPress themes and plugins. If you are a WordPress-based enterprise selling themes and plugins, you can use this tool to make data driven decision for your business. With this plugin, you can tracks the deactivation and activation rate of your plugins or themes.
This data helps you understand how users are interacting with your products. By analyzing this information, you can identify patterns and trends that may indicate areas for improvement or potential issues. Below are the things you can track with this tool.
- Theme and plugin’s deactivation/activation rate
- PHP version usage
- WordPress version usage
- MySQL version usage
- Server usage
- Multisite managed
- and more
With this information at hand, you can identify key metrics, analyze trends, and take actions to promote your plugins and themes more effectively to target audiences.
Make Data Driven Decisions on Employees, Customers, and Accounting Using WPERP
WPERP is a comprehensive WordPress plugin for enterprise resource planning (ERP). With this plugin, you can manage functionalities like managing employees, customers, and accounting within the WordPress ecosystem. The plugin has three modules – HR, CRM, and Accounting.
If you are a business organization and want to manage all sorts of information from these three departments through one single dashboard, you must try this software. Let’s explore how this plugin can help you manage the information of these three departments.
- Make Data Driven Decision on Employees
WPERP allows businesses to create detailed profiles for each employee, including personal information, job roles, and performance metrics. You can track their attendance, working hours, leaves, and overtime, providing valuable data for workforce management.
WPERP offers tools for evaluating employee performance through performance appraisals, goal setting, and feedback mechanisms. It allows you to make data-driven decisions regarding promotions, bonuses, and training opportunities.
With WPERP’s HR analytics features, you can analyze employee data to identify trends, patterns, and areas for improvement in their workforce management strategies.
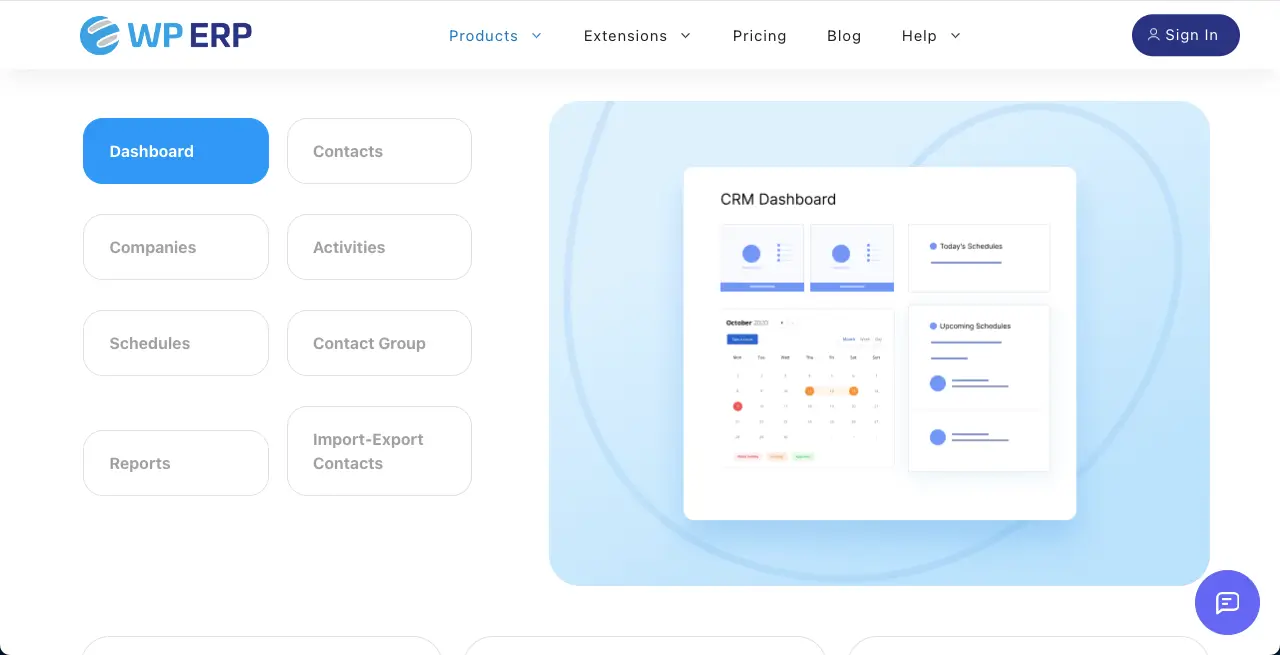
- Make Data Driven Decisions on Customers
You can maintain detailed profiles for each customer, including contact information, purchase history, and preferences with WPERP. You can track information like inquiries, sales, and support tickets. This enables you to better understand customer behavior and preferences.
You can segment customers based on various criteria, such as demographics, purchase behavior, and engagement levels. This helps you conduct targeted marketing campaigns and personalized communication.
- Make Data Driven Decisions on Accounting
WPERP includes accounting features to manage financial transactions, invoices, expenses, and payments within WordPress. The plugin offers reporting and analytics tools to track financial performance and generate balance sheets, profit and loss statements, and cash flow reports, providing insights into the financial health of the business.
WPERP facilitates budgeting and forecasting processes by allowing businesses to set financial goals, create budgets, and compare actual performance against forecasts, aiding in financial planning and decision-making.
With tax management features, businesses can ensure compliance with tax regulations, calculate taxes accurately, and generate tax reports, reducing the risk of errors and penalties.
Finishing Notes!
Being an expert in data-driven decision-making is no longer an option but a necessity. If you want to grow your career as a white-collar job holder, you must be competent in all aspects of data-driven decision-making. Besides, even if you are a small business owner, you need this skill to shine.
In this comprehensive guide, we have tried to provide you with a roadmap for leveraging data effectively to make strategic decisions, bypassing potential mistakes. If you want to insert something valuable in this post to make our analysis more meaningful, please comment on your insights below in the comment box.
Subscribe To Our Newsletter
Don’t miss any updates of our new templates and extensions
and all the astonishing offers we bring for you.
